“Look everybody, we gotta make this number go up! If we do that, we’ll win.” Maybe you can picture the meeting where a manager distills all of the analysis on how to improve the product down to a single performance metric. Everyone then goes back to work to do what he or she can about this special number. The metric could be a lot of things, such as product cost, cost of customer acquisition, or production rate. When done well, performance metrics can be useful because they reduce confusion and allow people to focus on one thing that, if improved, will make the bigger picture better.
In the pursuit of new technologies, products, and services, somebody must come up with one or more performance metrics to guide improvements. A good one that is already in use may appear obvious, but it may not have been before it was picked. Performance metrics need to be chosen carefully or else they cause confusion rather than clarity and lead to waste. Improving a basic performance metric leads to improving the customer’s experience with a better product. With a great one, it is easy to see how much an improvement in the metric results in improvement in the product.
Automotive Fuel Economy
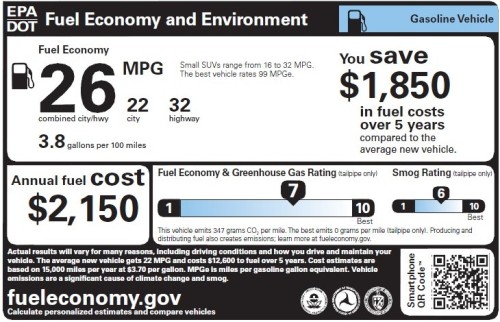
Automotive “miles per gallon” (MPG) fuel economy, a standard in the U.S., is my case to show how a metric can miss the mark and to show why it matter. That miles per gallon is controversial is no secret. Most of Europe, Japan, China, and many other countries communicate in terms of fuel consumption as L/100km instead of mi/gal. Even the new car label by EPA/DOT shows five different ways for how much fuel and how much emissions the car costs, illustrating their own lack of faith in miles per gallon.

Fuel economy relates to two typical questions, with follow-ons from there:
- What is the fuel cost for this vehicle for a given number of miles (per month, per year, etc.)?
- What is the emissions footprint for the vehicle for a given number of miles (per month, per year, etc.)?
So, let’s see what miles per gallon does and does not do for us.
Making the Math More Difficult
My first issue with MPG is that I can’t do a quick comparison in my head to figure out an improvement in fuel savings. Here’s an example: Pat recently upgraded his vehicle from a 1994 Ford Club Wagon that gets 13 mpg to a 2014 Honda Pilot that gets 20 mpg (quoted mpg’s are combined hwy/city for simplicity). He got another big vehicle so he can tow his boat. Pat is going to save money on gas. How much? Wouldn’t it be nice to get a ballpark figure in your head?
Working fuel cost out, suppose he buys gas at $3.50/gal (typical in California) and drives 10,000 miles per year, I calculate:
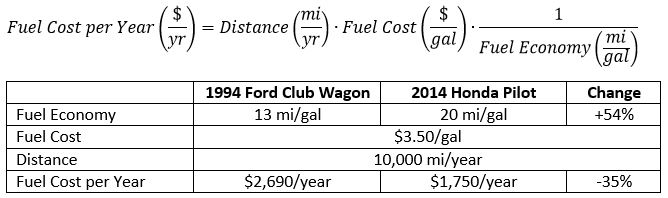
Pat would save 35% in fuel costs and about $940 per year in this example.
If you couldn’t do a comparison in your head, I can’t either. The headache in making a simple comparison here is that there are three steps, and they are all divisions.
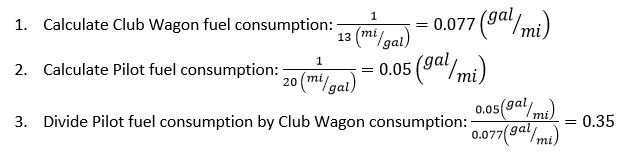
I could maybe guess a rough number for part 3 but not for all three together. Using fuel consumption as gallons per mile would be much easier than using fuel economy because it would eliminate steps 1 and 2 above.
I don’t think I’m nitpicking about hard math here. People are put into situations all the time when they have to do math on the go during tasks as common as grocery shopping. It makes everything faster if the math is easier. For consequential decisions, being forced into getting out your phone to do math takes your attention away from other important aspects of the decision. Picture losing a quarter of the time in your big meeting when the boss asked for a rough figure for something, and everybody started doing math instead of addressing the big picture issues. What a time sink!
Emissions Comparison
In another example from a friend, Sarah gave up her 2004 VW Golf diesel, at 36 mpg and got herself behind the sometimes-self-driving wheel of a Tesla Model 3. (Sweet.) She gets 100% renewable electricity from MCE’s Deep Green program here in the SF Bay Area so both her fuel consumption and CO2 emissions are zero (EPA lists a fuel economy equivalent of 123 MPG based on the electricity’s energy content). Sarah cut down her fuel use to zero, which is great. Did she reduce it more or less than Pat from the earlier example? Sarah may be a modern-day hero because she drives a Tesla, but let’s look in terms of the performance metric of miles per gallon.
The performance metric, using EPA numbers, says the Tesla purchase boosts MPG by 96 points whereas the Honda Pilot boosts MPG by only 7 points. So, is it Tesla for the win?

What looks like a lot bigger improvement for Sarah is really about the same improvement in terms of how much less gas Pat and Sarah are each purchasing over a 10,000 mile year.

In this case, you can’t judge the book by its cover, and that’s the point. A great performance metric would be like a book cover that accurately portrays what’s in the book. By contrast, using fuel consumption as gallons per mile makes a plot that looks the same as gallons per year. It’s pleasingly boring. A good performance metric shows the bottom line just looking at it so you can move on to the next question.

A Step Further: Cost of Emissions Reduction
Here’s a good next question: How do you get the greenhouse gas emissions of the light-duty fleet way down with the minimum economic pain? The U.S. has been working on the average fleet fuel economy for many years. The 96-point MPG boost of buying a Tesla would seem like the obvious way to do this, compared with the eye-roll-worthy 7-point boost of the Pilot upgrade. Let’s look at purchase price and yearly fuel savings (meaning gasoline and diesel). Vehicle values are from Nada Guides and Kelly Blue Book.
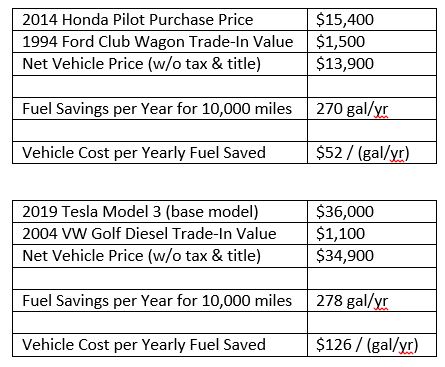
Sarah is spending ~2.5X what Pat is spending on a new vehicle for the same emissions reduction. If fleet emissions reduction in the goal, replacing lightly consuming cars with new, electric ones is far more expensive than replacing highly consuming cars with moderate, used ones. Unfortunately, miles per gallon, as a metric, obscures this observation. In terms of fleet emissions, high mile-per-gallon achievers are small enough to be irrelevant. The focus should be on fuel consumption and on those vehicles that are especially high consumers.
Why won’t Pat buy a Tesla instead of that gas guzzler SUV? Well, besides the price tag, he wants to tow a boat, and it’s simply a different product category. Following my earlier examples, a Rivian R1S would reasonably replace the Honda Pilot and save 500 gal/year of fuel, more than double the Tesla purchase.
Interesting Examples Imply Imperfect Metrics
If working through this example revealed anything interesting about fleet fuel use, it is a sign that the principle performance metric of miles per gallon was not serving its purpose very well. Perhaps, the headache example of miles per gallon fuel economy can serve as a case of why to spend a little extra time coming up with a sensible performance metric when the need arises. Ideally, performance metrics naturally teach us useful ways for how to compare products and services so we can make good decisions and move on to other problems.
